
The impact of the COVID-19 pandemic in the Japanese labor market; the reduced number of working hours at prefecture level in year 2020.
08/152023
Author: Ayako Wakano
The COVID-19 pandemic has brought a substantial effect on the global economy, such as an increase in the unemployment rate worldwide. Japan is not the exception. After three years passed since the first COVID-19 state of emergency in April 2020, it is already well-documented that the substantial economic shocks at the national and regional level were observed in Japanese. Recent publications appear to focus on the Japanese labor market situations.
In this chart of the week, I focus on the prefecture level data and attempt to investigate the heterogeneity in number of total working hours among prefectures, available from the Monthly Labor Survey (MLS). The Monthly Labor Survey (MLS) is a cross-sectional monthly survey conducted by the Ministry of Health, Labor and Welfare (MHLW).
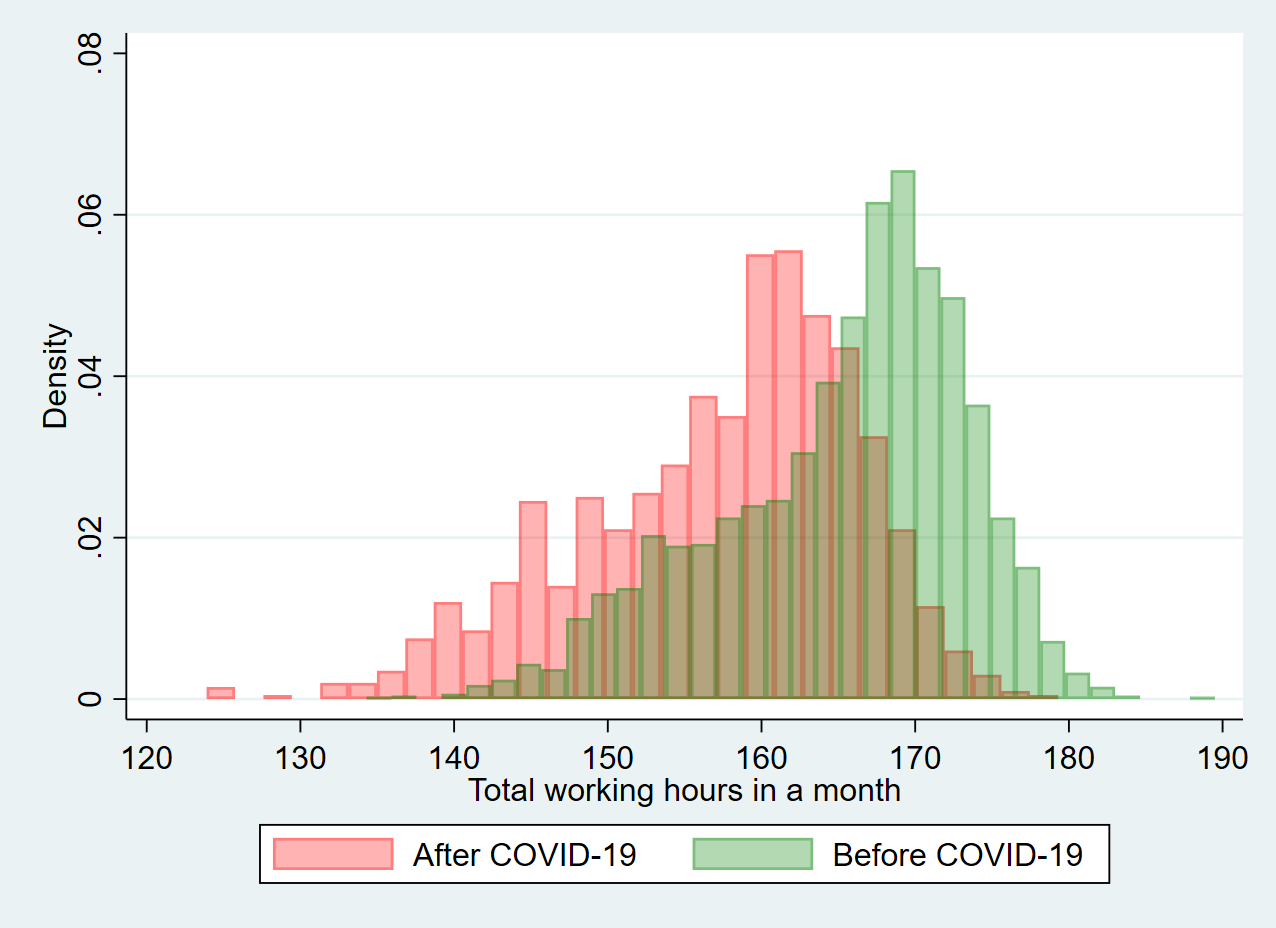
The figure 1 shows the histogram of total working hours per month before and after the COVID-19. It is apparent that the total working hours per month was substantially shortened after the COVID-19.
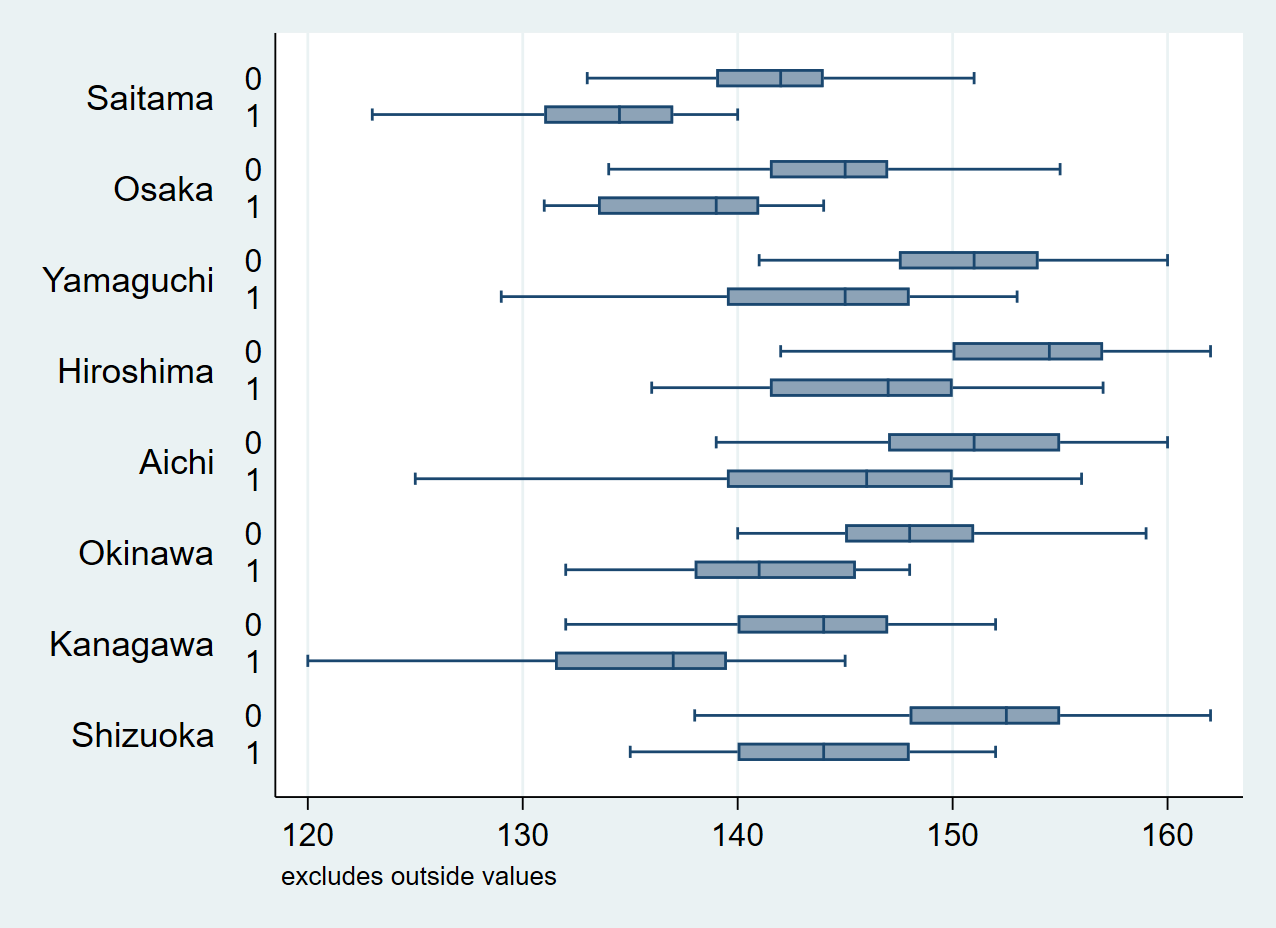
However, it is not uniformly observed in the entire country. The figure 2 shows the box plot of total working hours per month in each prefecture of Saitama, Osaka, Yamaguchi, Hiroshima, Aichi, Okinaka, Kanagawa and Shizuoka. Those prefectures faced the tremendous decrease in the total working hours in year 2020, compared to that of year 2015. In these prefectures, especially the minimum of total working hours in year 2020 was much smaller than that of year 2015. In the figure 2, 0 shows the year 2015 and 1 shows the year 2020. In those prefectures, the 75th percentile of total working hours per month in year 2020 did not even reach to that of the 25th percentile in year 2015.
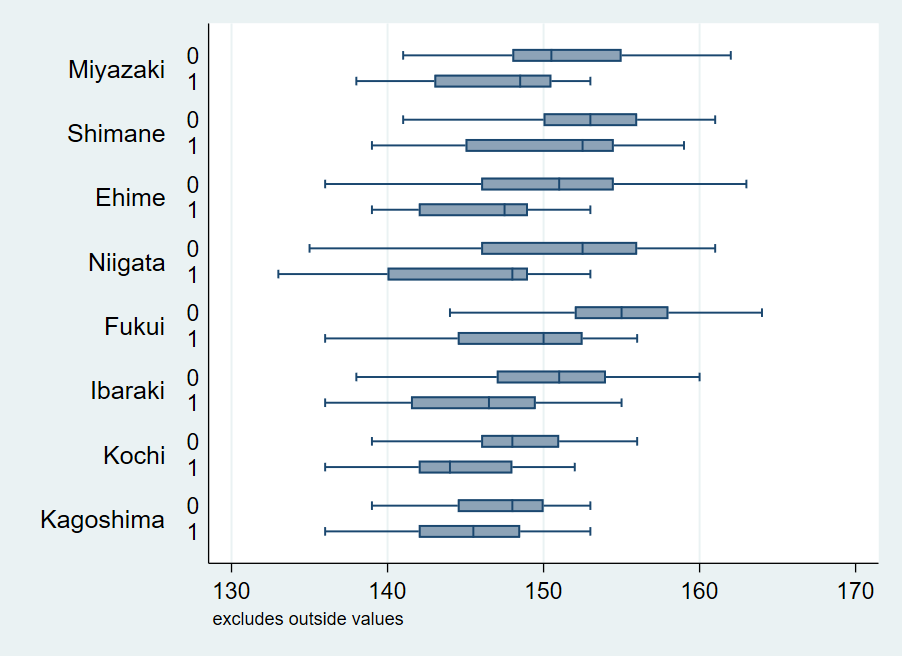
On the other hand, the figure 3 shows the box plot for each prefecture of Miyazaki, Shimane, Ehime, Niigata, Fukui, Ibaraki, Kochi and Kagoshima. Those prefectures did not experience much decrease in the total working hours in year 2020.
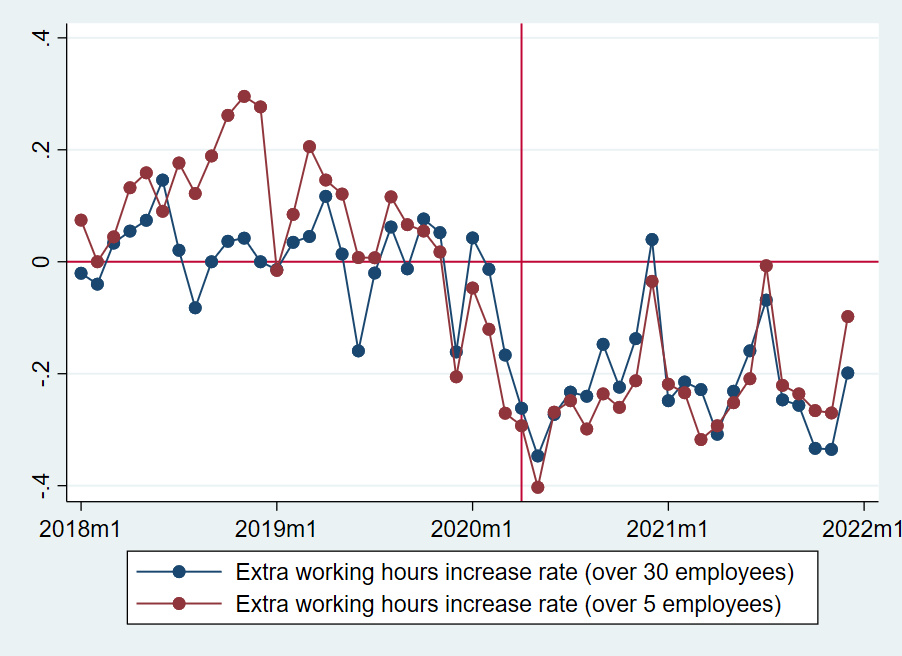
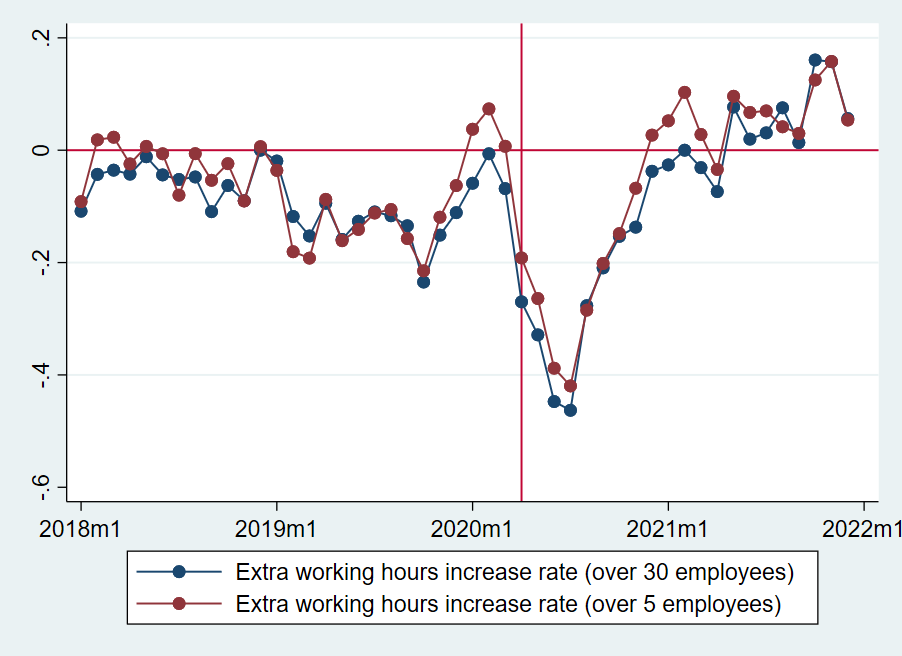
As mentioned above, I find it is heterogeneous among prefectures, comparing the total number of working hours in year 2020 with that in year 2015. Not only the total working hours per month, in terms of the length of the economic shocks, it is also varied among prefectures. As in figure 4 and 5, when looking at the monthly trend in each prefecture, the number of extra working hours in year 2020 and in 2021 did not recover to the level of year 2019 in some prefectures, while in others, the number of extra working hours in 2021 recovered to the level of year 2019. In this way, as the economic impact is greatly differed among prefectures, to investigate the long-term economic impact of COVID-19, it is required to look at the detailed situations in regional level.
 |
 |